

Tableau is a data visualization tool that is primarily used in the area of Business Intelligence, but is not limited to it. With Tableau you can create modern, interactive charts and reports and create complex dashboards. Tableau is used in almost every industry. It allows for much faster and more accurate data analysis, and thanks to its intuitive operation it is more friendly for business users.
See a sample report generated in Tableau:
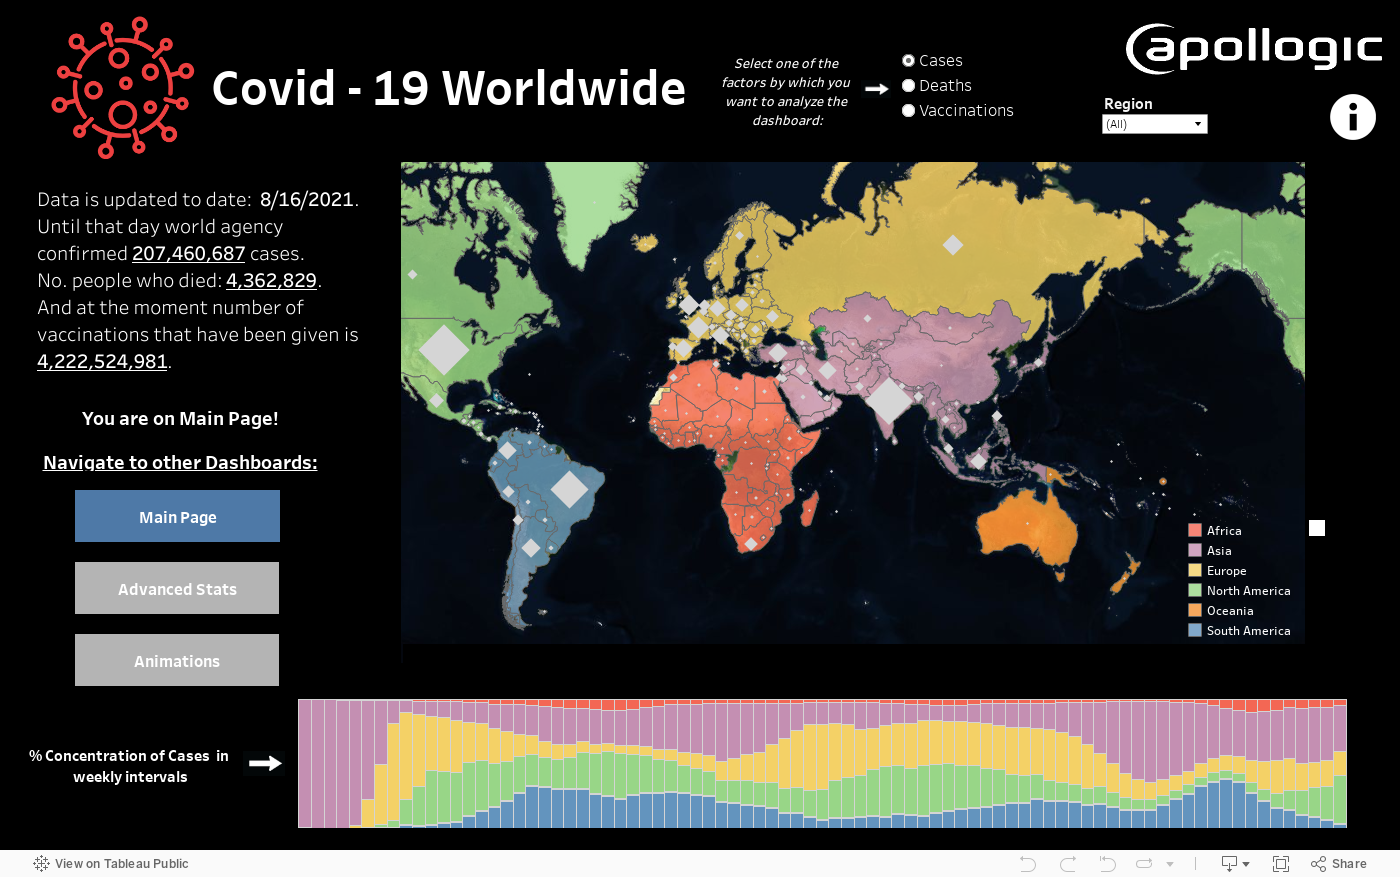

Tableau will change the way you work with data

Faster analysis by processing large amounts of information

Intuitive and easy to use dashboards

Decisions based on data, not intuition

Easy sharing with colleagues

Automatic and scheduled updates of data sources

Easy and fast integration possibilities with other systems

You know Tableau is a good choice when business users ask you for additional training because they've grown so fond of working with the tool.
Karol Kuchta, Business Intelligence Developer
Our offer

Implementation and configuration of the tool
Creation of reports and business analyses
Integration of different data sources with Tableau
End-user training
See what working with Tableau looks like
Why Apollogic?

Many years of experience and dozens of projects completed using Tableau

Group of certified consultants, developers, solution architects

A complementary team allowing for integration with other systems and data collection from IoT sensors

Official Partner of Microsoft and SAP with experience in implementing cloud solutions
Do you want to leverage the potential of your data?
Call or send us a message.
