ApoTwitterBoard – Proof of Concept
Amount of data in the world is growing fast. There are a lot of different sources of the data. One of them is social media. Analyzing data produced by users of social media such as Twitter or Facebook may bring a valuable insight for a company. In Apollogic we see benefits of analyzing social media content. We have developed a proof of concept of a tool to analyze tweets in real time – ApoTwitterBoard.

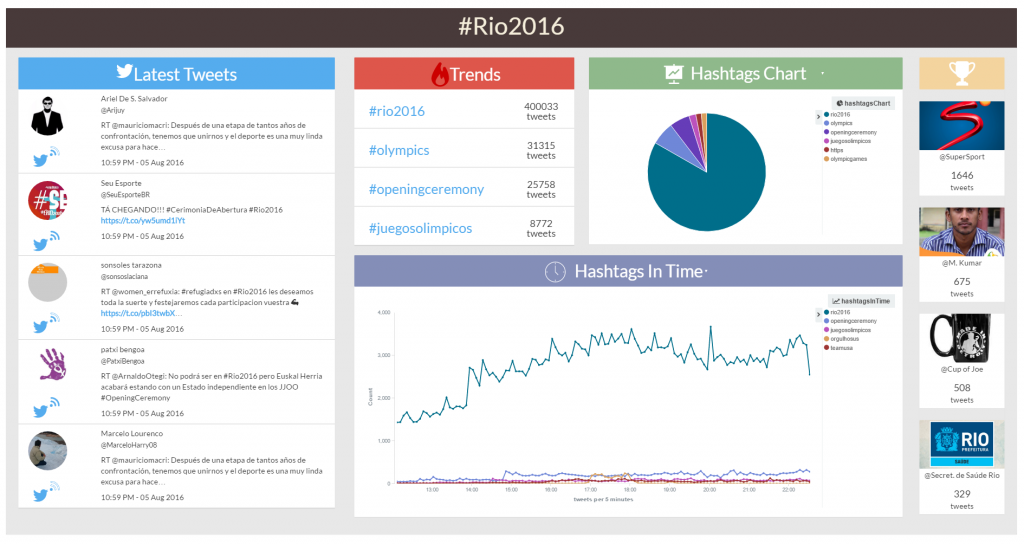
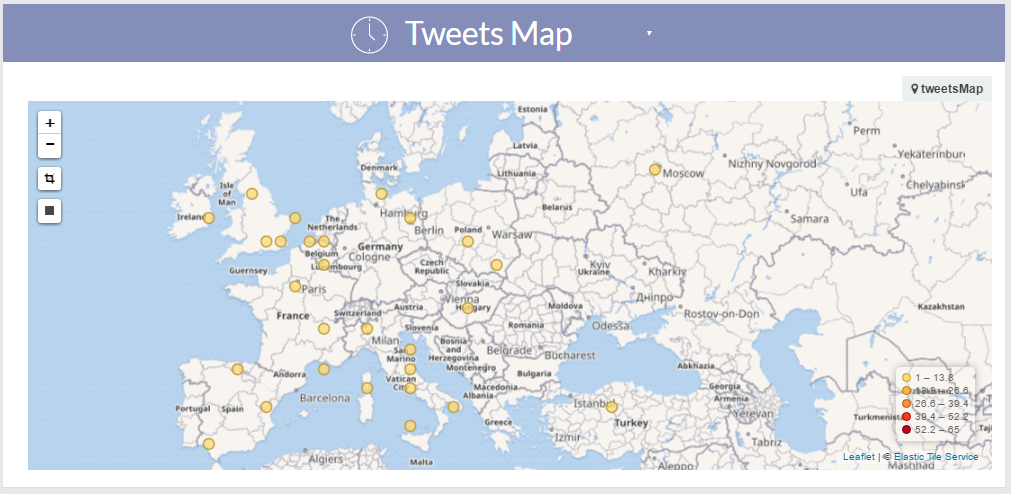
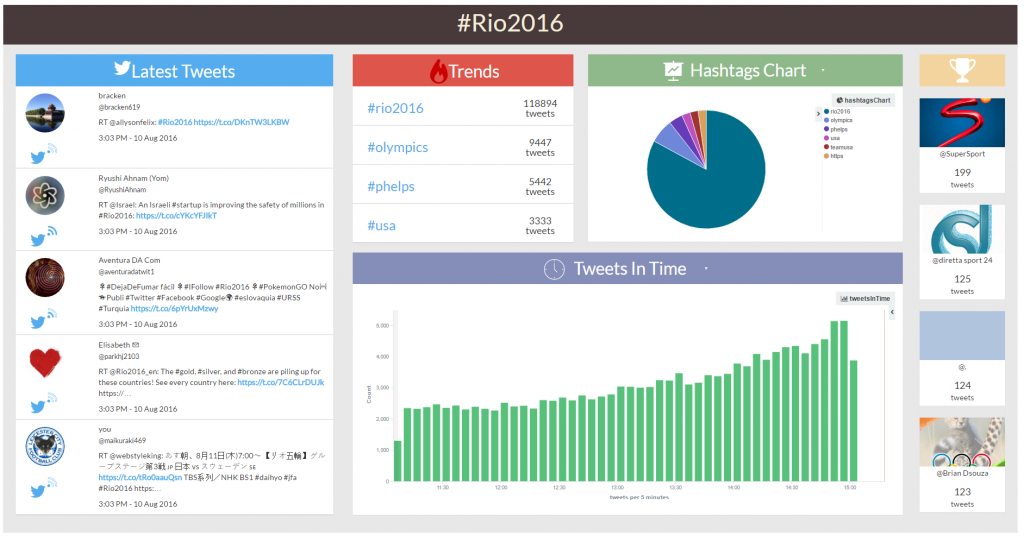
ApoTwitterBoard enables user to observe current tweets containing given keywords and displays statistics associated with these tweets. We have already implemented such statistics as trending hashtags or time ranges of increased or decreased overall activity. ApoTwitterBoard distinguishes also tweets coming from the most observed users and trendsetters. It shows most frequently tweeting users for currently observed keywords as well. E.g. during NATO Summit held in Warsaw at 8th and 9th of July among most active Twitter users were TVP Info and Polish think tank dealing with international affairs – PISM (The Polish Institute of International Affairs). Such information may indicate what users are worth to be observed in social media. Very useful features are visualizations implemented in ApoTwitterBoard. Besides a bar chart showing activity in given subject on a timeline there are also pie charts of most popular hashtags or locations of active users. It is also possible to visualize incoming tweets on a map. Visualizations elements may be changed by the user depending on his needs what provides valuable personalization.

ApoTwitterBoard may be very useful for a user monitoring reactions during the event, or feelings about a product or a company. It allows to discover some trends or valuable opinions well in advance. Hence it makes it possible to react fast adequately to users feelings. In Apollogic we use it during events that we attend. It is an eye-catching tool that may display e.g. tweets containing event name or keywords related to an event. It is also used by Marketing Team to recognize current trends and monitor social media during interesting events to make some conclusions.

In the example of boards related to #Rio2016 presented in the pictures we can see that during the 1st day of the Olimpic Games among the most popular hashtags was #openingceremony hashtag. On the 4th day very popular was #phelps hashtag after Michael Phelps won his 20th and 21st gold medal of Olimpic Games.
ApoTwitterBoard is based on Spark Streaming technology. Spark Streaming is an extension of the core Spark API that enables scalable, high throughput, fault-tolerant stream processing of live data streams. The stream of data can derive from many different sources such as Kafka, Flume and also Twitter. It was pretty convenient to use this technology with handy API that it provides. The code processing tweets in real-time (in fact in micro-batches, in our case 1s long) was written in Scala and it was good training for us to get our hands dirty with Spark and Scala language. It is possible to perform such data processing with other Big Data streaming tools such as Apache Storm or Apache Flink but Apache Spark is the most popular and in our opinion the most comprehensive tool. We find Apache Spark as a standard for many tasks in Big Data analysis and that is why we decided to use this tool for ApoTwitterBoard PoC. Our Spark cluster was set up on local servers.
The tool that we use to store tweets ingested from a stream is Elasticsearch. It is part of open-source Elastic Stack with Kibana, Logstash and Beats. This set of tools helps to take data from any source and any format to search, analyze and visualize it in real time. Data visualisations present on the ApoTwitterBoard were created in Kibana. With Kibana it is easy to create visualizations and dashboards on top of the content indexed on an Elasticsearch cluster. This set of tools is often used for logs stream storage and visualization.
ApoTwitterBoard in its initial stage is a valuable tool that may be very useful to analyze data from social media in real time. It may be especially interesting during events, either local conferences or global major events. Set of statistics that is provided by ApoTwitterBoard gives its user a valuable analytical insight derived from social media.
Article was written by Adam Maciaszek, Big Data Consultant at Apollogic.
- On 16/08/2016


0 Comments