Data analysis with SAP Analytics Cloud add-in for Microsoft Excel

Justyna Kaczmarek, Business Intelligence Consultant
- 31st August 2021
- Trends in SAP
- 3 min

Microsoft Excel is the industry-leading spreadsheet software program for most enterprises and the primary tool for analysis and reporting. Keeping in mind the popularity of the software, SAP Analytics Cloud developers are constantly improving the processes of SAC integration with Microsoft environment.
Currently, synchronization of Excel with the SAP Analytics Cloud platform is possible using the following approaches:
| SAP Analysis for Microsoft Office | SAP Analytics Cloud add-in for Microsoft Office |
| Software installation required | Based on Microsoft 365 platform, the software can be installed on the client’s server (on-premise |
| Allows advanced data analysis with planning features | Available on the Microsoft Store |
|
Available two versions:
|
Predictive analysis and planning oriented |
| Supported by standard Microsoft Excel application and online version |
The SAC add-in for Microsoft Office is the latest offering that allows advanced analysis using Excel features on data models previously built on the SAP Analytics Cloud platform. Below I present some of the most useful capabilities for data analysis in Microsoft Excel, which can be used with the installed add-in:
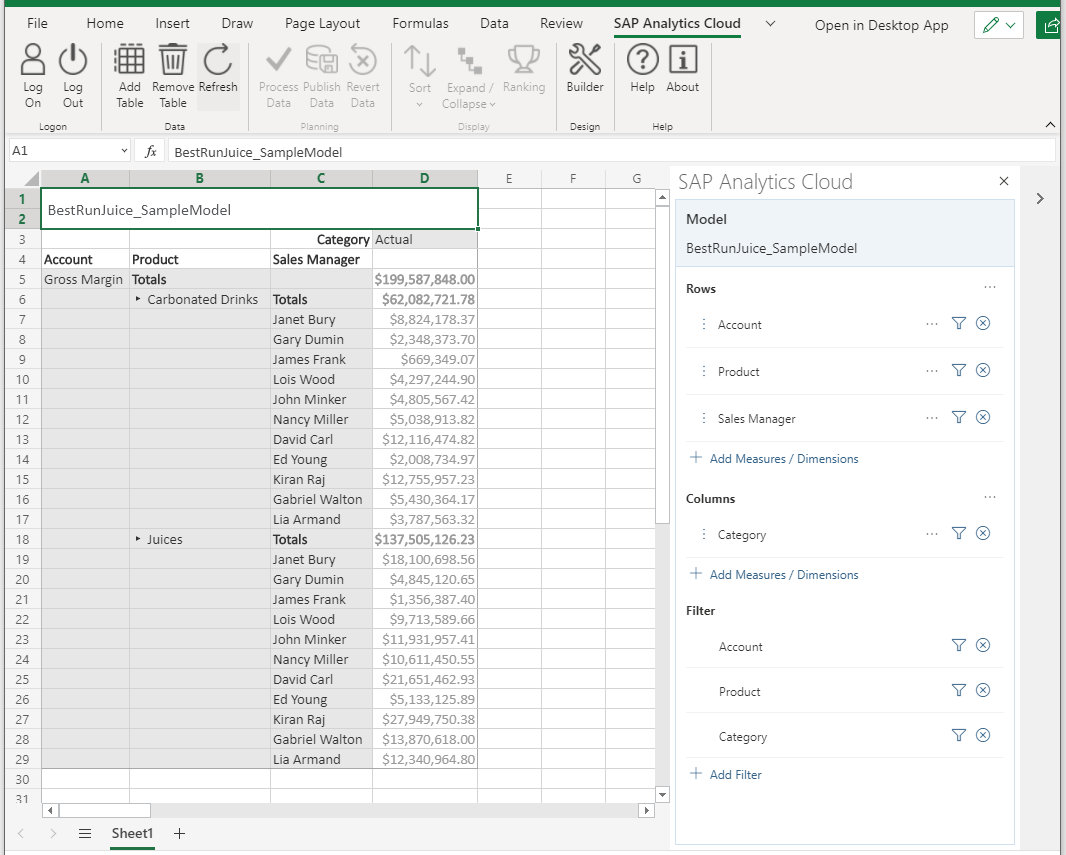
Add a table – it’s possible to add one or more tables to an Excel workbook and then modify them by, for example, changing data dimensions, adding hierarchies, and filtering options. Each table inserted into a workbook needs to be placed in a separate worksheet. If the worksheet you are currently working on already contains data tables, when you click Add Table, Microsoft Excel will automatically create a new worksheet and add the table in cell A1.
Navigating between tables is possible in two ways: by selecting a specified worksheet in the bottom bar – in that case, to display the model parameters panel, a user needs to click on any cell inside the table – or by searching for the table name from the drop-down list located on the left side of the function bar.
If you use the second method, the side panel with model parameters will be displayed automatically when you move to the sheet with the table.
Add Measures/Dimensions – the side panel of the table contains options that allow adding calculations and dimensions separately for columns and rows. By clicking the Add Measures/Dimensions button, you will see a list with categories to choose from, the order of which can be easily modified by dragging and dropping on the selected item.
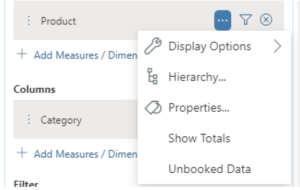
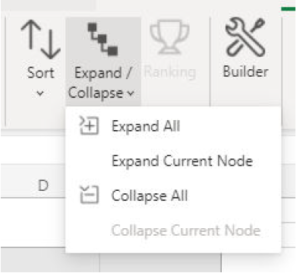
Context Menu – for each category, additional features can be found by selecting the first icon to the right of the item. With Show Totals, we can get partial or overall totals for particular columns or rows, and with Hierarchy, also available on the top bar, we can collapse or expand all data groups or just one of them, depending on the selected cell and required level of detail.
Filter Data – in order to make the analysis more precise, in the filtering window, you can group all the data contained in the table or only in terms of created hierarchies. Besides, there is a search box, where, having a choice of Match Case and Whole Word Only variants, you just need to type the required phrase or its fragment, and then SAC will display all records containing it.
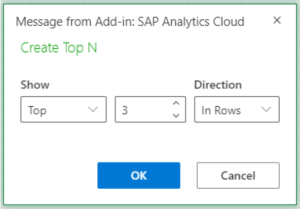
Ranking – option is available from version 2021.14 of the Excel add-in and complements the Filter Data feature discussed above. Just like the filtering command, this option narrows the displayed records according to the value of the “N” parameter that determines the number of returned rows sorted by specified criteria.
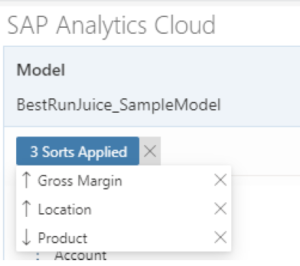
Sorting – users that want to sort data in the right order can choose from three sorting options – default, descending, or ascending. Depending on the currently selected cell, it’s possible to sort the data in relation to the main categories or only in terms of a subset of elements. Now used sorting options are displayed in the side panel, wherefrom the drop-down list, we can easily cancel the selected variant and restore the default data ordering.
For more details about data processing capabilities offered by SAP Analytics Cloud add-in for Microsoft Office, visit SAP HANA Journey.
Do you need support in integrating SAP Analytics Cloud with Microsoft Excel?
- On 01/09/2021


0 Comments